Laws of Bibliometrics
The qualitative and quantitative analysis of scientific publications, particularly articles, is important for revealing the change in scientific fields. Bibliometrics can be defined as the ‘mathematical and statistical methods employed in the analysis of scientific communication tools such as journals and books. The development and growth of bibliometrics as a subject is tremendous. It has grown into a distinctive research area, although there was a steady growth of its literature. This has become possible because it could motivate many researchers from other disciplines to work on various facets of bibliometrics. A brief survey of some of the most important contributions in bibliometrics is provided here to show the rapid growth of knowledge in bibliometrics. In this article, we are going to show you the Laws of Bibliometrics and Application of Bibliometrics Laws.
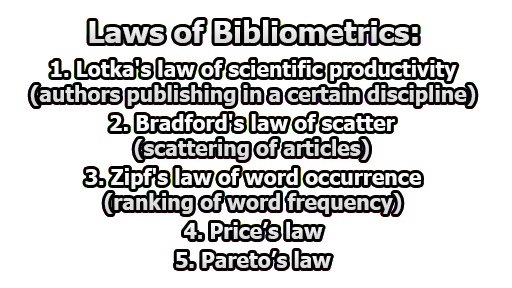
One of the main areas in bibliometric research concerns the application of bibliometric laws. Five main laws can be listed in bibliometric studies;
These Laws of Bibliometrics are described as follows;
1. Lotka’s law: Lotka’s law dealt with authors’ publishing and the number of papers published. In 1926, Alfred J. Lotka purposed his inverse Square Law correlating contributors of scientific papers to their number of contributions. His law provided a formula for measuring/predicting the productivity of scientific researchers.
Lotka’s law, in its generalized form, seems applicable.
- When we consider the publications of authors in one periodical and
- When we consider all the publications of the authors in various journals, the observed values deviate considerably from the predictions of the law.
Lotka developed a “general formula for the relation… between the frequency y of persons making x contributions” as
” x x y = a constant.”
or, xy = a^n (inverse sqare)
or, 1/n² (n=2)
or, 100/2² = 25
Finding the value of the constant when n = 2, he observed that, the number of persons making 2 contributions is about one-fourth of those making one; the number making 3 contributions is about one-ninth, etc; the number making n contributions is about 1/n² of those making one, and the proportion, of all contributors, that make a single contribution, is about 60 percent.
In other words, for every 100 contributing one article, 25 will contribute two articles, about 11 will contribute 3 articles and 6 will contribute 4 articles, and so on.
Table: RANKING OF AUTHORS
|
No. of authors |
No. of articles |
|
100 |
1 |
|
25 |
2 |
|
11 |
3 |
|
6 |
4 |
|
4 |
5 |
Lotka doesn’t take impact into account, only production numbers.
2. Bradford’s Law: Samuel Clement Bradford (1934), observed the scattering of articles on specific subjects in various journals. He pointed out that if scientific journals are arranged in order of decreasing productivity of articles on a given subject, they may be divided into a nucleus of periodicals more particularly devoted to the subject and several groups and zones containing the same number of articles as the nucleus when the number of periodicals in the nucleus and succeeding zones will be 1: n: n2. Bradford’s Law states that journals in a single field can be divided into three parts, each containing the same number of articles:
- A core of journals on the subject, relatively few in number, that produces approximately one-third of all the articles;
- A second zone, containing the same number of articles as the first, but a greater number of journals, and
- A third zone, containing the same number of articles as the second, but a still greater number of journals.
The mathematical relationship of the number of journals core to the first zone is a constant n and to the second zone, the relationship is n². Bradford expressed this relationship as 1:n:n². Bradford formulated his law after studying a bibliography of geophysics, covering 326 journals in the field. He discovered that 9 journals contained 429 articles, 59 contained 499 articles, and 258 contained 404 articles. So it took 9 journals to contribute one-third of the articles, 5 times of 9, or 45, to produce the next third, and 5 times 5 times 9, or 225, to produce the last third. Bradford’s Law serves as a general guideline to librarians in determining the number of core journals in any given field. Bradford’s Law is not statistically accurate, but it is still commonly used as a general rule of thumb.
3. Zipf’s Laws: This law enunciated by George K. Zipf is best on the frequency of occurrence of words in a text and their ranking in descending order. The study covered James Joyce’s Ulysses, Beowulf, and the ILIAD, for which indexes and concordances are available. The analysis, of the novel Ulysses by using Zipf’s law is given below, as an example.
The novel contains 2, 60,430 totally running words, of which 29, 899 unique word forms. A frequency table of words that were in the novel, arranged in the order of decreasing frequency, was available ready-made. By analysis, it reveals that the product of a word (r) and its frequency (f) was a constant. For instance, the tenth most frequent word, (r = 10) occurred 2, 653 times (f = 2,653); the hundredth word (r= 100) occurred 265 times (f = 265), the two hundredth word (r = 200) occurred 133 times (if = 133) and so on. Zipf’s analyzed the words and arranged these in descending order of frequency and multiplied the numerical value of each rank (r) with its frequency (if) and arrived at a product (c). Zipf’s law states “that if words occurring in natural language text of sizeable length were listed in the order of decreasing frequency, then the rank of any given word in the list would be inversely proportional to the frequency occurrence of the word”.
Zipf’s equation is rf = c Where r and f are, rank and frequency of words, respectively, and c is constant. Zipf’s derived the law from a general principle of “least effort”. Words whose cost of usage is small or whose transmission demands the least effort, are frequently used in large text. This is also illustrated in a subject index using a controlled vocabulary. All the descriptions, or terms, that are in a controlled vocabulary, will not be with the same frequency, on the contrary, few terms are overused and some are rarely picked up. Zipf’s law utility lies in the fact that the law can measure an author’s richness in vocabulary.
Table: RANKING OF WORDS OCCURRENCE
| Rank (r) | Frequency (f) | Product (c) |
| 1 | 400 | 400 |
| 2 | 200 | 400 |
| 3 | 133 | 399 |
| 4 | 100 | 400 |
| 5 | 80 | 400 |
4. Price’s Law: Derek de Solla Price made several analyses to estimate enabled scientists by comparing scientists. Price’s square root law has its basis in Lotka’s Law. Price’s Law states that half of the publications on a subject are contributed by the square root of the total number of authors publishing in that area (Sengupta, 1992). For instance, if we take the number of authors in education management as 225 and the number of articles as 1500, 750 of these articles are written only by 15 people. It is argued that Price’s law is a different form of Lotka’s Law (Klamer & Dalen, 2002).
5. Pareto’s Law: Pareto’s law is also known as the 80/20 law. It estimates that 80% of publication parts (for instance, number of articles and citation) produce 20% of the sources (for instance, journal and author). For instance, Pareto’s law argues that 20% of the most productive educational sciences journals publish the 80% of articles in the educational sciences field. It, at the same time, suggests that 80% of the all articles are written by 20% of the authors in the field (Ravichandra Rao & Neelanghan, 1992).
Application of Bibliometrics Laws:
As Bibliometrics lies between the border areas of the social and physical sciences, its techniques have extensive applications equally in information management, librarianship, history of science including science policy, the study of science and scientists, and also in different branches of social sciences and scientists. Some of the areas where bibliometrics techniques are consistently being applied are enumerated here:
- to identify research trends and growth of knowledge of different scientific disciplines;
- to estimate comprehensiveness of secondary periodicals;
- to identify users of different subjects;
- to identify authorship and its trends in documents on various subjects;
- to measure the usefulness of ad hoc and retrospective SDI Services;
- to forecast past, present, and future Publishing trends;
- to develop experimental models correlating or bypassing the existing ones;
- to identify core periodicals in different disciplines;
- to formulate an accurate need-based acquisition policy within limited budgetary provision;
- to adopt an accurate weeding and stacking policy;
- to initiate effective multilevel network Systems;
- to regulate the inflow of Information and communication;
- To study obsolescence and dispersion of scientific literature (clustering and coupling of scientific papers etc.);
- To predict the productivity of publishers, individual authors, organizations, country or that of an entire discipline;
- To design automatic language processing for auto-indexing, auto-abstracting, and auto-classification; and
- To develop norms for standardization.
References:
- SENGUPTA L. N. (1992). Bibliometrics, Informetrics, Scientometrics, and Librametrics. An Overview.
- Klamer, Arjo & Van Dalen, Hendrik P. (2002). Attention and the art of scientific publishing. Journal of Economic Methodology. 9. 289-315.
- Ravichandra Rao & Neelanghan, (1992). Map of Scientific Publication in the field of Educational Sciences and Teacher Education in Turkey: A Bibliometric Study.
- Diodato, V. P. (1994). Dictionary of bibliometrics. New York, NY: The Hawthorne Press.

Assistant Teacher at Zinzira Pir Mohammad Pilot School and College

