Role of Descriptive Statistics in Research:
Descriptive statistics play a vital role in research across various fields, providing researchers with a comprehensive and meaningful way to summarize and interpret data. These statistics help researchers gain insights into the underlying patterns, trends, and characteristics of their data. Here are the key role of descriptive statistics in research.
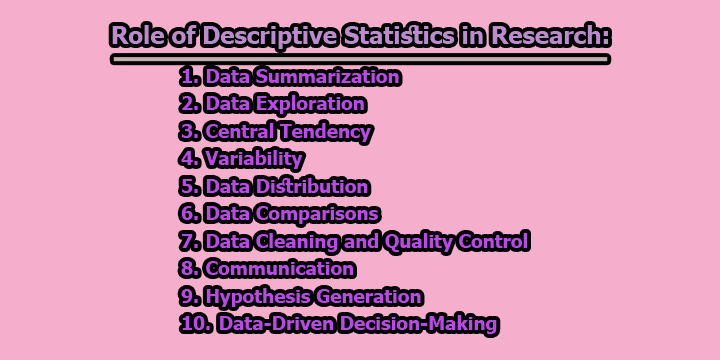
1. Data Summarization: Descriptive statistics play a crucial role in research by providing a systematic way to summarize complex datasets. They condense raw data into manageable values that offer an overall understanding of the data. For instance, when conducting a survey on customer satisfaction, summarizing the responses with metrics like the mean, median, and standard deviation allows researchers to gauge the overall sentiment and identify the level of consensus or variation among respondents (Levin, Fox, & Forde, 2017).
2. Data Exploration: Before diving into more advanced statistical analyses, researchers use descriptive statistics to explore their data. This exploration involves examining data distribution, identifying outliers, and assessing data quality. For example, generating a histogram or a box plot can reveal the shape of the data distribution and any extreme values that may require attention (Field, 2013).
3. Central Tendency: Descriptive statistics provide measures of central tendency, such as the mean, median, and mode. These statistics are essential for identifying the typical or average value within a dataset. In educational research, for instance, calculating the mean test score in a class provides insight into the performance level of the students, helping educators tailor their teaching strategies (Gravetter & Wallnau, 2013).
4. Variability: Measures of variability, including the range, variance, and standard deviation, are integral components of descriptive statistics. They quantify how data points deviate from the central tendency. Researchers use these measures to gauge the extent of variability within their datasets. For instance, in financial analysis, the standard deviation of a stock’s daily returns can indicate its level of risk and volatility (Bodie, Kane, & Marcus, 2014).
5. Data Distribution: Descriptive statistics facilitate the understanding of data distribution, including whether the data is normally distributed, skewed, or exhibits other patterns. Visualization tools like histograms, frequency tables, and box plots help researchers identify the shape and characteristics of data distributions. In epidemiology, for example, analyzing the age distribution of a population can provide insights into the prevalence of certain health conditions among different age groups (Katz, Peberdy, & Finer, 2014).
6. Data Comparisons: Descriptive statistics are essential for comparing different datasets. Researchers can use summary statistics to compare and contrast the characteristics of multiple groups. In a clinical trial, for instance, researchers may use descriptive statistics to compare the efficacy of a new drug (treatment group) to a placebo (control group) by analyzing and contrasting key outcome measures (Altman & Bland, 1996).
7. Data Cleaning and Quality Control: Descriptive statistics play a vital role in the data cleaning and quality control process. Researchers employ them to identify and rectify data errors, missing values, or outliers. This step is crucial in ensuring the accuracy and reliability of the data for further analysis. In healthcare research, data cleaning is particularly important to maintain the integrity of patient records (Dixon, 2008).
8. Communication: Descriptive statistics are indispensable in the communication of research findings. They provide readers with a clear and concise summary of the data, making the research more accessible and understandable. In social sciences, for instance, summarizing survey responses using descriptive statistics simplifies the presentation of research results to a broader audience (Fink, 2019).
9. Hypothesis Generation: Exploring descriptive statistics can lead to the generation of hypotheses or research questions. For example, if an analysis of socioeconomic data reveals a significant income disparity in a specific region, this may lead researchers to formulate hypotheses about the underlying causes of this disparity and potential interventions (Mackenbach et al., 2015).
10. Data-Driven Decision-Making: Descriptive statistics are instrumental in data-driven decision-making in applied fields like business, healthcare, and social sciences. They provide decision-makers with a quantitative overview of the information, enabling them to make informed choices. For instance, in business, analyzing descriptive statistics related to customer preferences can guide product development and marketing strategies (Eisenmann, 2002).
In conclusion, descriptive statistics serve as the foundation of research and data analysis. They help researchers make sense of their data, identify trends and patterns, and communicate their findings effectively. While they don’t provide the full picture, descriptive statistics are an essential initial step in any research endeavor, paving the way for more advanced statistical analyses and drawing meaningful insights from data.
References:
- Altman, D. G., & Bland, J. M. (1996). Statistics Notes: Comparing several groups using analysis of variance. BMJ, 312(7033), 1472.
- Bodie, Z., Kane, A., & Marcus, A. J. (2014). Investments (10th ed.). McGraw-Hill Education.
- Dixon, P. (2008). The efficient use of statistical tools for quality and process control. CRC Press.
- Eisenmann, T. R. (2002). Strategic decision-making in start-ups. The MIT Sloan Management Review, 43(3), 34-41.
- Field, A. (2013). Discovering statistics using IBM SPSS Statistics. Sage.
- Fink, A. (2019). How to conduct surveys: A step-by-step guide (6th ed.). SAGE Publications.
- Gravetter, F. J., & Wallnau, L. B. (2013). Statistics for the behavioral sciences. Cengage Learning.
- Katz, L. M., Peberdy, M. A., & Finer, N. (2014). Resuscitation from shock. In P. M. Kleinman, L. M. Atkins, & J. C. Reilly (Eds.), Atlas of Emergency Medicine (4th ed.). The McGraw-Hill Companies.
- Levin, N., Fox, J. A., & Forde, D. R. (2017). Elementary statistics in social research (12th ed.). Pearson.
- Mackenbach, J. P., Stirbu, I., Roskam, A. J., Schaap, M. M., Menvielle, G., Leinsalu, M., … & Kunst, A. E. (2008). Socioeconomic inequalities in health in 22 European countries. New England Journal of Medicine, 358(23), 2468-2481.

Assistant Teacher at Zinzira Pir Mohammad Pilot School and College
