Importance of Descriptive Statistics in Research:
Descriptive statistics are a fundamental and often underappreciated part of any research project. They serve several crucial purposes that are essential for the research process. Here are some of the key importance of descriptive statistics in research:
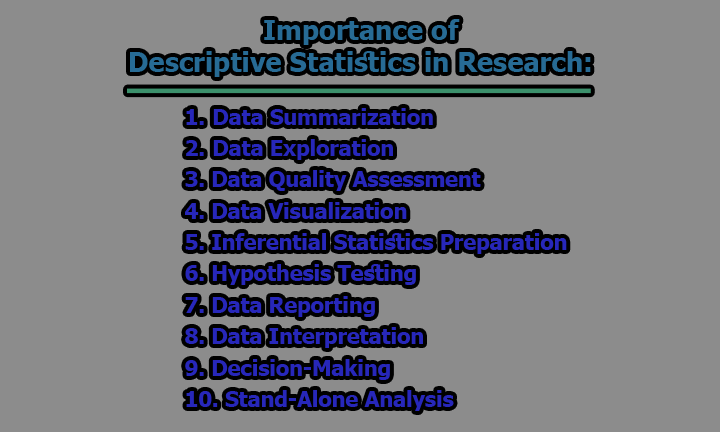
1. Data Summarization: Descriptive statistics serve as a tool to condense and summarize a large and complex dataset into key statistics that provide a quick snapshot of the data. The central tendency statistics, like the mean (average), median (middle value), and mode (most frequent value), offer insights into where the data clusters. For example, knowing the mean income in a sample can provide a quick understanding of the average earnings of the population being studied. The measures of variability, such as the range and standard deviation, tell you how spread out the data is. If the range is large, it suggests significant variation in the data, while a small standard deviation indicates more homogeneity. This summarization is invaluable for researchers who need to communicate the main features of the data concisely.
2. Data Exploration: Descriptive statistics are the first step in exploring your data. They allow you to get a sense of the data’s characteristics and structure. For example, a histogram can provide a visual representation of the data’s distribution, showing whether it’s normally distributed, skewed, or exhibits multiple peaks. This early exploration can help researchers identify patterns and trends that may guide further analysis. Moreover, by looking at the central tendency, you can quickly grasp whether data tends to cluster around a specific value, giving you a sense of what’s typical or expected in the dataset.
3. Data Quality Assessment: Descriptive statistics play a crucial role in assessing the quality and integrity of your data. They can reveal anomalies and data issues that need to be addressed before conducting more advanced analyses. For instance, if you observe extreme outliers in your data, it may indicate data entry errors or unusual cases that require investigation. Identifying missing data is also vital because it can affect the completeness of your analysis. By examining descriptive statistics, you can spot these issues early on and take corrective actions to ensure the data’s reliability.
4. Data Visualization: Descriptive statistics are often accompanied by data visualization techniques. Visualization complements the numeric summaries and provides an intuitive way to grasp the data’s characteristics. Histograms, for example, display the data distribution in a visual form, making it easier to identify patterns and deviations. Box plots help identify outliers and show the spread of the data. Scatter plots can reveal relationships between variables. The combination of descriptive statistics and visualization enhances your ability to communicate findings and insights to both technical and non-technical audiences.
5. Inferential Statistics Preparation: Descriptive statistics are essential in preparing for inferential statistics. Before you can perform hypothesis testing or regression analysis, you need to understand the nature of your data. Descriptive statistics inform you about the distribution of your data, which is crucial for selecting the appropriate inferential tests. For instance, if your data is normally distributed, parametric tests may be appropriate, whereas non-parametric tests are suitable for non-normally distributed data. Descriptive statistics also help you decide on sample size, data transformation, and the assumptions that need to be met before conducting inferential analysis, thus ensuring that your inferential results are valid and meaningful.
6. Hypothesis Testing: Descriptive statistics serve as a foundation for forming hypotheses in the research process. After examining the descriptive statistics of a dataset, researchers often make preliminary observations about the data, which can lead to the formulation of research questions and hypotheses. For example, if the mean test scores in two groups differ significantly, this initial observation may lead to a hypothesis that there is a true difference between the groups. These hypotheses guide the subsequent steps of the research, including data collection and the choice of statistical tests.
7. Data Reporting: Descriptive statistics are a critical component of research reports and publications. They provide a succinct and meaningful way to present the main characteristics of the dataset and the key findings. Readers can quickly grasp the essential information about the data, such as the average values, the spread, and the shape of the distribution, which are vital for understanding the research results. Effective reporting with descriptive statistics makes research findings more accessible and interpretable for a broader audience.
8. Data Interpretation: Descriptive statistics help in interpreting the practical significance of research findings. Researchers not only need to know if there is a statistically significant difference or relationship but also whether the observed differences or patterns are practically meaningful. Descriptive statistics assist in this interpretation by providing context. For instance, if a drug trial reports a statistically significant increase in patient survival rates, the descriptive statistics can convey the magnitude of this increase, which is crucial in determining the drug’s clinical significance.
9. Decision-Making: Throughout the research project, descriptive statistics aid in making informed decisions. Researchers rely on these statistics to decide on data collection methods, research design, and the direction of their analysis. By examining descriptive statistics, researchers can make choices about the most appropriate data collection instruments, sample sizes, and analysis techniques. These decisions are fundamental to the success of the research and its ability to answer the research questions effectively.
10. Stand-Alone Analysis: In some research contexts, especially exploratory or descriptive studies, descriptive statistics may be the primary focus of the analysis. Not all research projects require advanced inferential statistics. For example, in market research, it may be sufficient to describe the demographics and preferences of a target audience without delving into complex hypothesis testing. In such cases, descriptive statistics can provide all the necessary insights to address the research objectives and answer the research questions effectively.
In conclusion, descriptive statistics are not merely a preliminary step in research but a critical part of the entire research process. They provide the foundation for sound data analysis, hypothesis testing, and meaningful interpretation of results. Researchers should pay careful attention to descriptive statistics to ensure the integrity and validity of their research findings.

Assistant Teacher at Zinzira Pir Mohammad Pilot School and College
